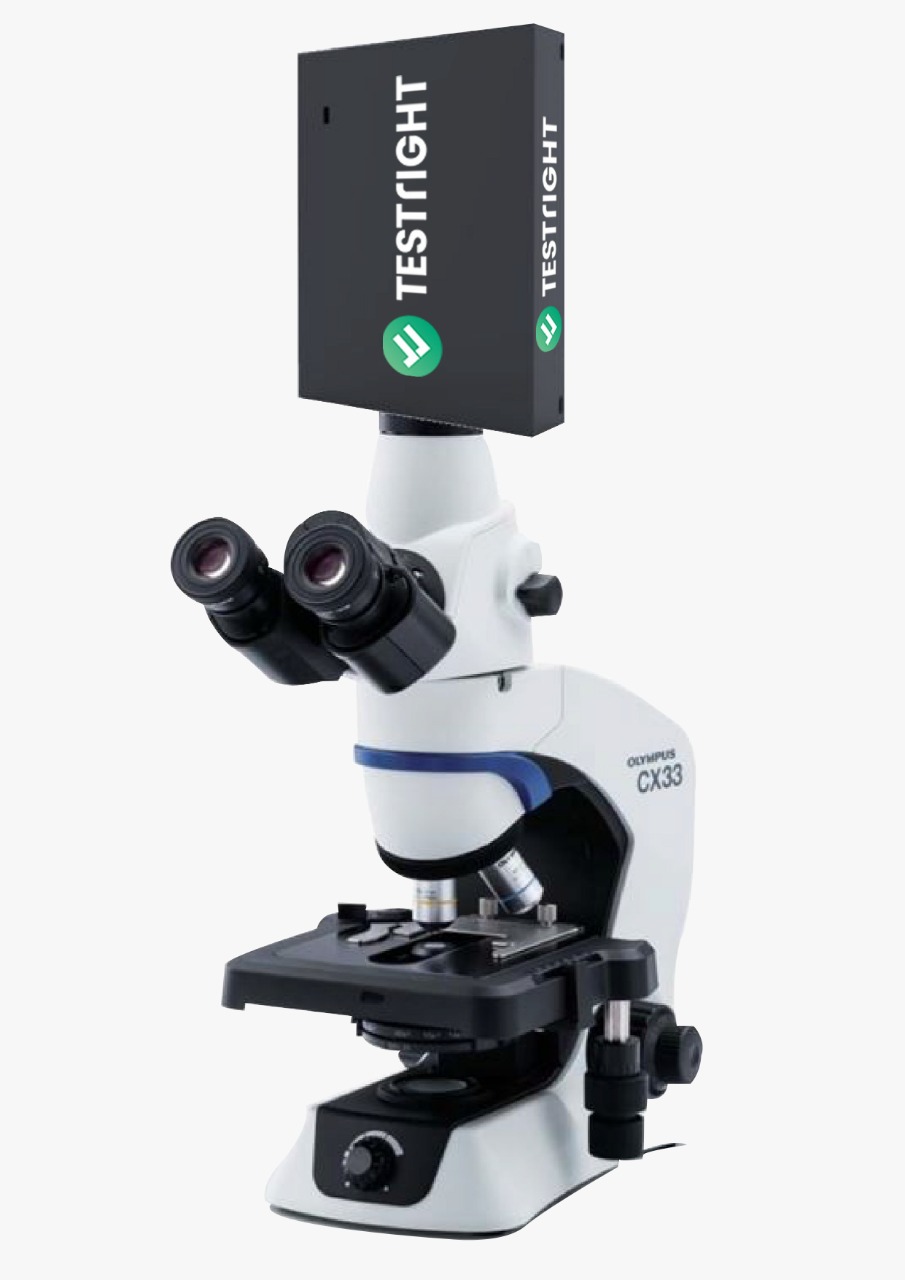
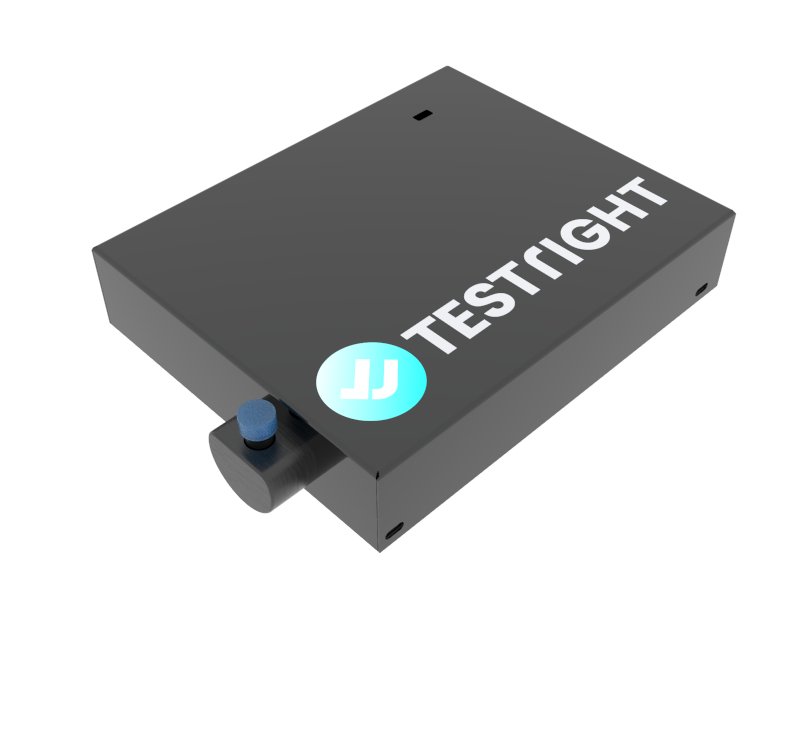
Indigenous benchtop Raman Spectrometer with integration time 1 ms-60 sec for detection of weak signals.
Raman spectroscopy is an indispensable technique that is being taught to students at prominent educational institutions across the globe. That’s why TestRight offers its range of Prizm Raman spectrometers which is an unique instrument that combines the advantage of a portable probe system with the performance of a highly specified laboratory instrument.
Background
Raman Spectroscopy is a non-destructive chemical analysis technique that provides detailed information about chemical structure, phase and polymorphy, crystallinity, and molecular interactions. It is based upon the interaction of light with the chemical bonds within a material. That is why it has become an indispensable technique that is being taught to students at prominent educational institutions across the globe. And the ability to conduct experiments in the classroom using compact and portable instrumentation allows the instructor to illustrate the concepts better and helps students grasp the course content with better clarity. This is where TestRight steps in with its state-of the-art yet affordable spectroscopic solution: Prizm Raman.
Testright's PRIZM RAMAN
Specifications :
- Prizm Raman is a unique instrument that combines the advantage of a portable probe system with the performance of a highly specified laboratory instrument.
- It is a perfect choice for Raman analysis when the acquisition of high-quality data is essential.
- With fast acquisition within 5 seconds for most samples, it comes with an electronic shutter enabled 0.1ms-60s integration time, a sturdy body, and customized laser power.
- Available with 532, 785, and 1064 nm laser excitation, it provides superior sensitivity with low noise.
- It has a built-in high-speed mini USB for full control of the spectrometer and is supported by the software SpectroSmart, making it compatible with all systems operating on Windows, Ubuntu, or Android.
EXPERIMENTS
EXPERIMENT-1
Validation of different pharmaceutical products:
(a) Paracetamol
(b) Aspirin
Specifications :
- Paracetamol/Aspirin tablets should be used to prepare three types of samples.
- At first, a whole tablet is analyzed using the spectrometer with a relatively short integration time of 10 seconds.
- For the next sample, the tablet is crushed into powder form and is analyzed at an integration time of 40 seconds.
- Then a few aqueous samples should be prepared, for which 0-3 Paracetamol/Aspirin tablets can be partially dissolved in 20mL hydrochloric acid (5% v/v), to mimic stomach contents. For this, students can use a spatula and vigorous stirring to break up the tablets until each solution has a milky-white appearance with small particles of the tablets suspended in the solution. This sample is then analyzed.
- Then each solution can be scanned three times with an integration time of 40 seconds, and for each solution, the Raman signal intensity can be recorded at 1657 per cm.
- The data obtained can be compared to literature values of paracetamol/Aspirin, and can be used to determine the best fit line and the limit of detection
Results
As shown in Fig. 1, the Raman spectra (Paracetamol-Red & Aspirin-Green), of both solid Paracetamol and Aspirin tablets can be obtained. The transparent outer coating of the tablets won’t interfere with the Raman signal. An almost identical spectrum can be obtained for their respective powdered samples. And with the help of these values, a calibration curve for the aqueous sample solutions can be made and the limit of detection can also be determined to be approximately 0.1 tablets.
EXPERIMENT-2
Visualization of Scissoring, Wagging, Rocking, and Stretching of CH-Bonds in organic solution samples
Procedure :
- In this experiment initially, a 40 second integration time should be used for each calibration standard, but both DMSO and ethanol solutions with concentrations above 70% v/v can be found to saturate the CCD.
- This can be resolved by shortening the integration time to 20-s for those two analytes.
- Then, using the mean intensity of a prominent Raman shift in each spectrum, aqueous calibration curves can be created. And detection limits for each analyte can also be determined.
Results
Raman spectra and aqueous calibration curves can be obtained by students for solutions of dimethyl sulfoxide (DMSO), isopropyl alcohol, methanol, and ethanol. Some experimental details for each analyte are given in Table 1, and an example of a spectrum and calibration curve for DMSO is presented in Fig. 2.
EXPERIMENT-3
Identification of gemstones: Purity check of diamond
Procedure :
- Raman spectroscopy can allow students to identify the chemical identity and origin of gemstones based on the Raman spectral ID, in comparison to the library spectra for gems from various sources.
- For this experiment, students can perform scans on the diamond sample and a gem sample like moissanite or quartz, that has physical resemblance to diamond.
- Then on obtaining the spectra for different gemstone samples, students can observe their distinct Raman peaks caused because of the different carbon-carbon vibrations at the molecular level of each gemstone.
Results
Students can observe the difference between diamond (black line) and diamond (red line) simulant on the market as highlighted in Fig. 3 as diamond has a carbon-carbon vibration Ramanspectrum showing a single Raman shift at 1332 cm-1, which confirms the authenticity of pure diamond whereas, the Raman shift for the diamond simulant shows a broader Raman spectrum with six major Raman shifts. Students can also tell the difference between pure diamond (black line) at 1332 cm-1, and quartz (red line) at 520 cm-1 with the help of obtained spectra as shown in Fig. 4.
EXPERIMENT-4
Identification of different polymers: Polystyrene(PP), Acrylonitrile Butadiene Styrene(ABS) and Polypropylene(PP)
Procedure :
- Sorting of plastic using Prizm Raman has great advantages like- no reference signal is required, surface conditions and moisture have fewer effects and the signal to noise ratio is easily achieved by a pumping laser.
- Students will need different thermosetting plastic samples for this experiment.
- And with the scanning time of 6ms per sample, students can obtain the spectrum with characteristic peaks of each sample with good SNR.
Results
As shown in Fig.5, students can obtain the Raman spectra of PP, PS and ABS. Peaks can be seen around 3000cm-1 in all the spectra, which are attributed to the stretching of CH or OH bonds in all the plastic samples. Styrene’s (PS and ABS) and PP are distinct by the peak for ring breezing in benzene structure, and hence PP has a peak around 1000cm-1. For Styrene, the apparent peak of CN stretching around 2250cm-1 makes it possible to decide on PS and ABS, which are otherwise not distinguishable. Thus Prizm Raman’s multivariable analysis can successfully help students to distinguish plastic components and classify them.
Conclusion
We found that TestRight’s indigenous Prizm Raman spectroscopic device is an indispensable tool for students' and instructors' spectroscopic needs, as it is pocket-friendly, easy to use, gives fast results, and provides hands-on experience and clarity on Raman spectroscopy concepts by complementing the theoretical study material.