Portable UV-Vis Spectrophotometer compatible with Liquid/Solid/Thin-film samples. Upgradable to fluorescence and dip probe for continuous monitoring
Production of biosimilars has become an integral part of the pharmaceutical industry globally. And all of this stands on the fact that there is an analytical similarity between the biosimilar and the innovator product. To fulfill the industry need for the characterization of biosimilars, TestRight offers affordable spectroscopic solutions.
Background
In India, biosimilars are termed as “similar biologics'' and are presently developed according to the guidelines issued by the Central Drugs Standard Control Organization (CDSCO) under the Ministry of Health and Family Welfare.In India the clinical relief is predicated on the assumption that there is an analytical similarity between the biosimilar and the innovator product. As a result, establishing analytical similarity is arguably the most important step towards the successful development of a biosimilar.Thua a nondestructive and sensitive technique has been developed to undertake the analysis of biosimilars using spectroscopic techniques for the pharmaceutical industry. And this is where TestRight steps in with its wide range of state-of-the-art spectroscopic devices that are pocket-friendly and easy to operate.
Testright's Devices
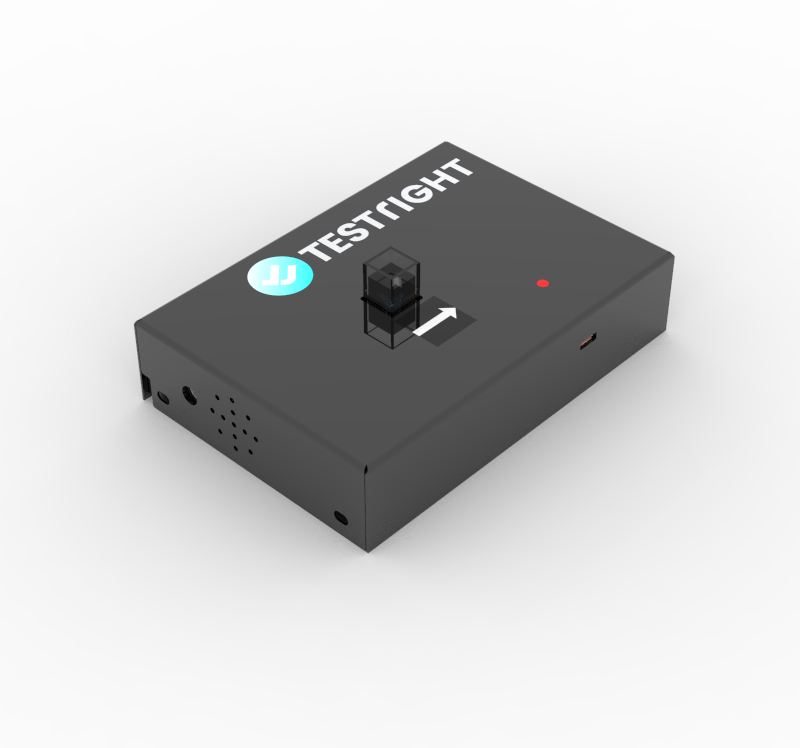
PRIZM FLUORO FLUOROMETER
Specifications :
- Indigenously developed, state-of-the-art narrowband tunable excitation sources which increase the sensitivity and dynamic range of detection; allowing the user to measure very high or low fluorescence signals without detector saturation.
- modular design ensures that the instrument can be upgraded for more excitation sources in the future as your demand expands.
- It is a compact fluorometer that is a sensitive and flexible solution for a fraction of the cost of a traditional spectrofluorometer.
- It has portable units which can fit in confined spaces like a laminar hood and supports all liquid, thin films, and solid samples.
- It has an emission range in discrete modules from 200-980nm which is software adjustable and comes with the software SpectroSmart, which is compatible with all systems running on Windows or Ubuntu.
Research Observation
- Fluorescence spectroscopy provided an insight into the tertiary structure of the biosimilar molecules.
- The changes in the intrinsic fluorescence spectra for all rituximab biosimilars and Ristova® as shown in Fig. 1, indicated absorption of aromatic amino acids (Trp, Tyr) centered with λmax at 347 nm, revealing that Trp are exposed to the external environment.
- Biosimilar 3 and 4 showed λmax with a red-shift (moved to longer wavelength) by 2 nm, revealing that Trp had become more solvent exposed in those samples.
- On the other hand, the changes in extrinsic fluorescence spectra for all rituximab biosimilars and Ristova® as shown in Fig. 2, indicated continuous increase in fluorescence at 450 nm and decrease at 520 nm when excited at 280 nm, revealing that the hydrophobic patches and apolar sites didn’t change in those samples.
- And thus, it was concluded that the higher order structures of the rituximab biosimilars were similar to that of Ristova®.
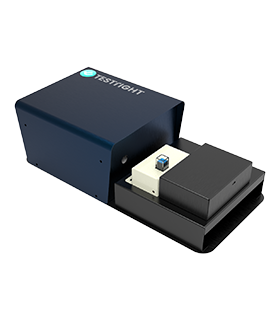
PRIZM ABS-SPECRTOMETERS
Specifications :
- In the pharmaceutical industry, the main applications of TestRight’s devices are the detection of conformational changes, concentration analysis and determination of protein secondary structure present in the biosimilars, which can easily be achieved using TestRight’s range of Prizm Abs spectrophotometers.
- Due to their specific design that facilitates fast data acquisition with high sample throughput.
- The devices come with kinetics, full-spectrum, and OD modes, and are equipped with portable units, making them fit in confined spaces.
- They operate on back-thinned CCD- array technology, making the device portable, compact, and long-lasting as they have no rotating parts.
- Along with providing simultaneous scanning at all wavelengths within 1 sec, they also report directly in g/L, ppm, etc, and are compatible with flow cells.
- The devices are compatible with smartphones, enabling field applications. Testright also provides free software upgradation and remote support.
Research Observtion
- The information content of the IR protein spectrum is not limited to the amide I band. Since IR spectroscopic data follows Lambert-Beer´s law, the protein spectrum can be utilized for concentration determination.
- Also, side chains of various amino acids can be monitored and directly compared under varying environmental conditions (pH, salts, ligands), or in mutant proteins with altered primary sequence.
- Fig. 3 shows the IR spectra of Hemoglobin and Tendamistat. The Hemoglobin amide I band has a position (~1652 cm-1) and shape clearly indicative of a protein with a high α-helical content whereas, the Tendamistat amide I band is characteristic (broad peak at ~1635 cm-1) of a protein with high β-sheet content.
- Fig. 4 shows the lysozyme IR spectra for low concentrations (0.15 μg/ μl - 2.2 μg/μl), with an acquisition time of 100 seconds.
- And Fig. 5 shows the lysozyme IR spectra for high concentrations (2.2 μg/μl - 45 μg/μl), with 25 seconds acquisition time.
- These spectra clearly demonstrate the correlation between IR signal intensity and protein amount over a large dynamic range.
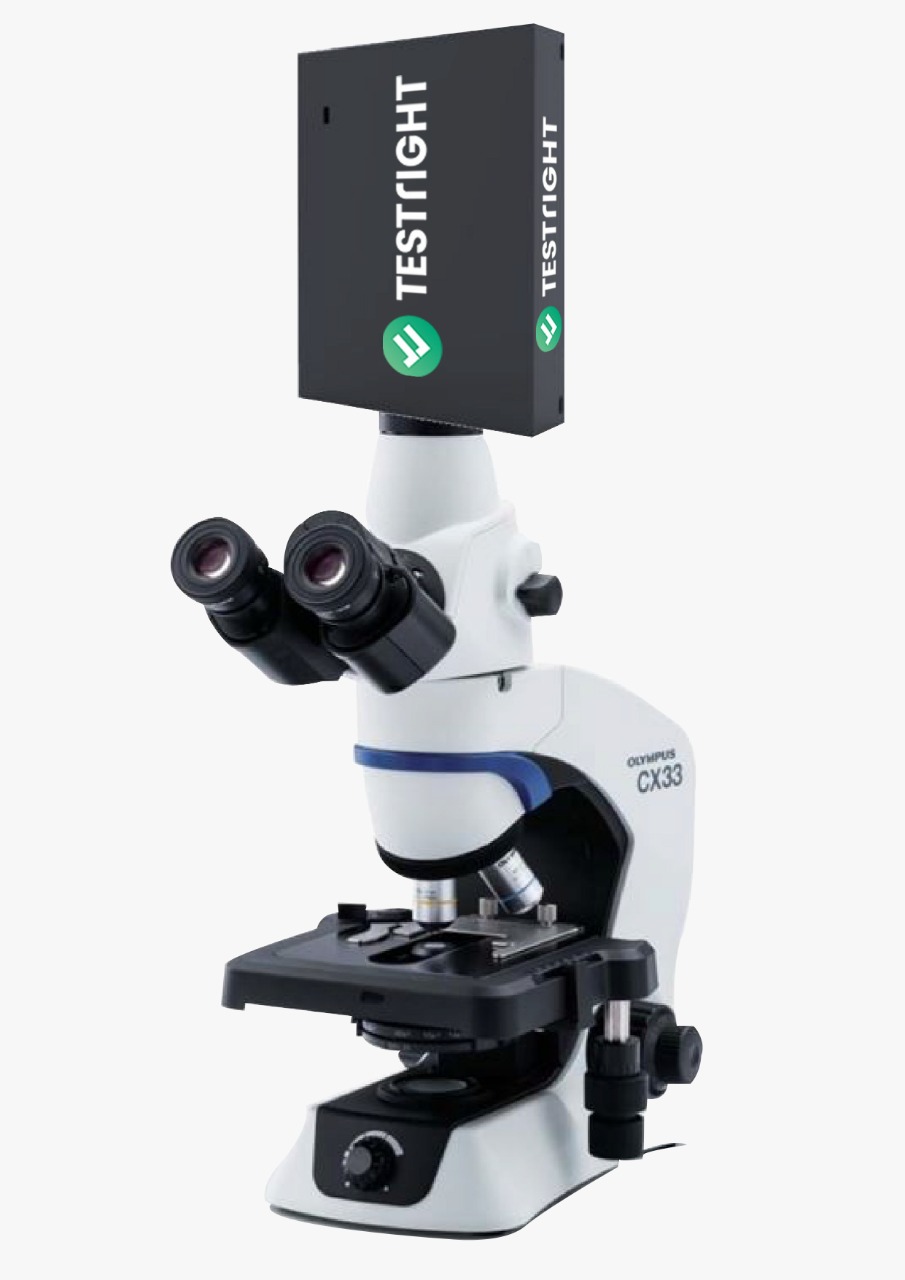
RAMAN SPECTROSCOPY IN MICROENCAPSULATION
Specifications :
- Testright offers its PRIZM RAMAN range of spectrometers. Prizm Raman is a unique instrument that combines the advantage of a portable probe system with the performance of a highly specified laboratory instrument.
- It is a perfect choice for Raman analysis when the acquisition of high-quality data is essential.
- With fast acquisition within 5 seconds for most samples, it comes with an electronic shutter enabled 0.1ms-60s integration time, a sturdy body, and customized laser power.
- Available with 532, 785, and 1064 nm laser excitation, it provides superior sensitivity with low noise.
- It has a built-in high-speed mini USB for full control of the spectrometer and is supported by the software SpectroSmart, making it compatible with all systems operating on Windows, Ubuntu or Android.
Research Observtion
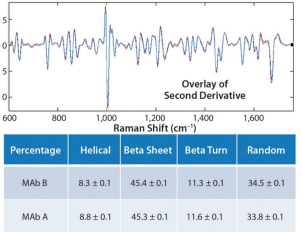
- During a study, Raman spectroscopy was employed to compare comprehensive biophysical property profiles of MAb A (innovator product) and MAb B (biosimilar product in a modified formulation), having obtained them at formulated conditions (50 mg/mL).
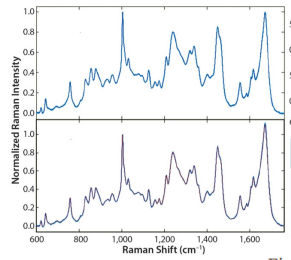
- The MAb samples were examined in their original formulation without dilution and the processed raman spectra were compared with their second derivatives and the percentage of secondary structure components as shown in Fig. 6.
- The Raman spectra for MAb A and MAb B appeared practically identical, as did the second derivatives of those spectra overlaid atop one another across the 600–1,800 cm–1 spectral region.
- In addition, the deconvoluted percentage of secondary-structure components were in good agreement with each other.
- Taken together, these data strongly suggested that MAb A and MAb B were highly similar in their secondary and tertiary structure.
- Representative Raman spectra of MAbs A and B (left panel, top: MAb A & bottom: MAb B); second-derivative overlay of Raman spectra for MAbs A and B (top right panel); and comparison of deconvoluted secondary-structure percentages for MAbs A and B (bottom right panel)
Conclusion
Testright's PRIZM range of spectrometers and classification models have been proved reliable in characterizing proteins in biosimilars, and their application can be expanded to even a wider range as they can be used even at very low concentrations of sample biosimilars. And through the use of modular spectroscopy components and spectral data, measurements could also be taken outside the lab environment to test the quality, safety, and shelf life of pharmaceutical products.